Theory
This part of the lab exercise will be the basis for writing the next lab report.
Green plants have green leaves, and the leaves are green because of the green pigment
called chlorophyll which is involved in photosynthesis. Well, yes, but it's really more complex
than just this.
A leaf has evolved, chemically and structurally, to optimize photosynthesis (Greek:
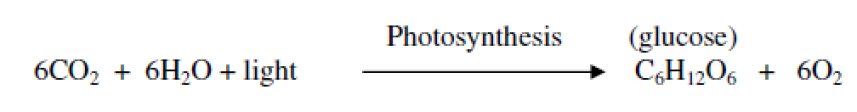
photo=light). The overall function of the biochemical process of photosynthesis is to absorb
light energy and convert it into chemical bond energy that is then useable by the plant; this
chemical bond energy is within the glucose sugar which is synthesized by the photosynthetic
process. Thus, it is sometimes said that a plant gets its “food” (glucose) from sunlight. The
“inputs” required by photosynthesis are light, carbon dioxide and water, and the “outputs”
produced are glucose and oxygen. Your textbook provides greater detail of the biochemical
process involved in photosynthesis.
Let's focus on LIGHT and its capture by a cell. The visible light spectrum ranges from red (the longest wavelength) through orange, yellow, green, blue, indigo, and finally violet (the shortest wavelength), and plants possess pigments that can absorb light in specific regions of the spectrum (see Figure 1). One of the green pigments that absorbs light for use in photosynthesis is called “chlorophyll a”; it readily absorbs violet/blue and red light but not much of the lighter blue, and green and yellow light. “Chlorophyll b” is structurally only slightly different from chlorophyll a, but its absorption spectrum is somewhat different. Chlorophyll b absorbs more in the blue and orange-red ranges. Thus, chlorophylls appear green because the pigments absorb light in all of the other color ranges, and only green is transmitted to our eyes. Due to the slightly different absorption spectra, chlorophyll a looks bluish green, while chlorophyll b looks yellowish green.
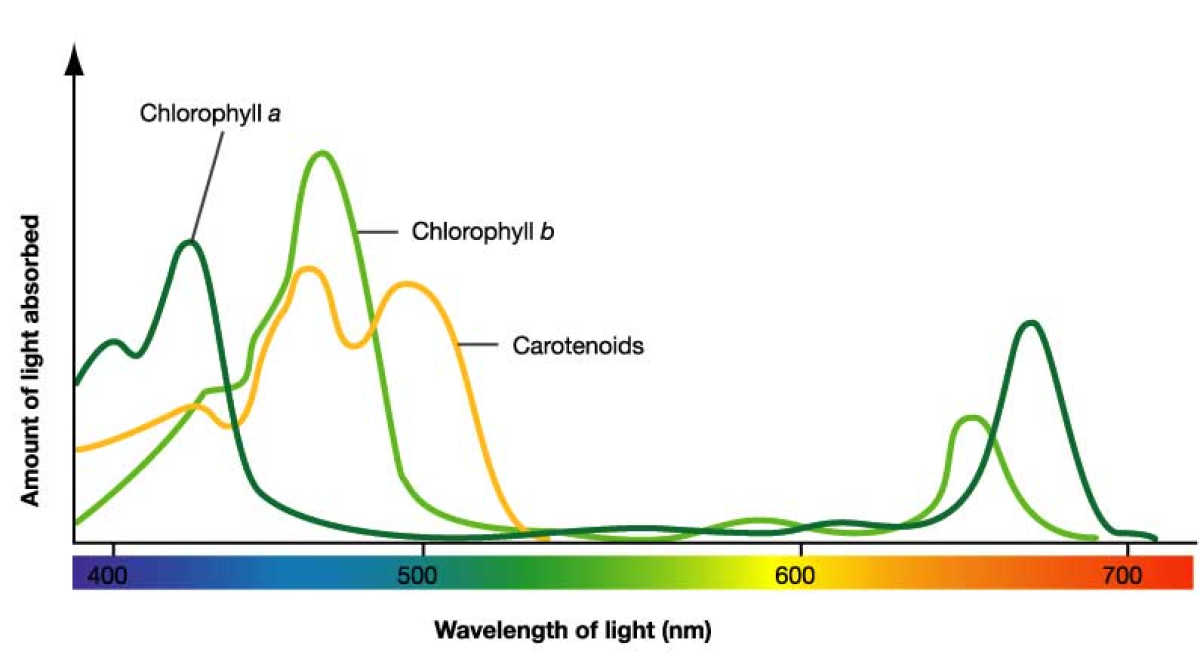
The absorbance spectrum, in the visible light range, of chlorophyll gives interesting results. The chemistry of chlorophyll creates three blue absorbance peaks at 416, 454, and 482 nm, and one red absorbance peak at 670 nm. The combination of these wavelengths is green to the human eye, but different sources of chlorophylls will have different ratios of these peaks, which create various shades of green. Thus, in the world of chlorophyll, all greens are not the same.
The primary objective of this experiment is to determine the concentration of various chlorophyll containing olive oils using their absorbance properties. You will use a Vernier Spectrometer to measure the absorbance by chlorophyll in each oil sample. You will measure the absorbance of extra virgin olive oil over the visible light spectrum and select the wavelength of maximum absorbance (λ max). A higher concentration of the solution absorbs more light (and transmits less) than a solution of lower concentration. The extra virgin olive oil has a chlorophyll concentration (molarity) of 9.82 x 10⁻⁶ mol/L. You will first calculate the chlorophyll concentration for each of the five serial dilutions that were made from the extra virgin olive oil. You will then use the Vernier spectrometer to measure the absorbance and transmittance of each dilution at the λ max. The graph of absorbance or transmittance vs. concentration for the serial dilutions will describe a direct relationship, known as Beer's Law.